Have increased mortgage rates made housing more expensive in Oakville, Milton, and Burlington?
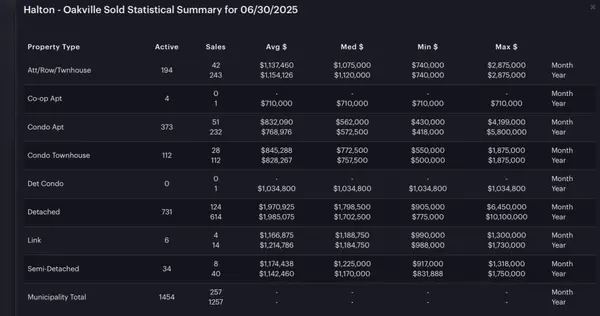
Oakville's average selling price went up from June to July by 6% to $1,524,000 and is up 7% from last July, but down 16% from it's peak in March.
Milton's average selling price went down by 1.7% from June to $1,082,214 which is up by 6% from last July but down 20% from it's peak in February.
Burlington's average selling price went down 9% from June to $1,135,359 which is still up from last year by 8% but down from it's peak in February by 23%.
What do all these numbers mean really?
Let's take a look at what the best 5 year fixed rates were at the peak of the market and compare them to today's 5 year fixed rates and apply them to the peak average prices compared to today's average prices at today's rates:
Oakville's peak average price of $1,856,258 was in March 2022 when, according to Rate Hub, the best discounted 5 year rate was 2.59%:
Average Price Rate Monthly Payment w/20% down
$1,856,258 2.59% $6717/month
Total Paid (5yrs) Total Principal Total Interest End Balance
$403,144 $225,857 $177,287 $1,259,149
Compared to Oakville's peak average price of $1,524,237 in July and the best discounted mortgage rate available now of 4.24%:
Average Price Rate Monthly Payment w/20% Down
$1,524,237 4.24% $6574/month
Total Paid (5yrs) Total Principal Total Interest End Balance
$394,432 $153,470 $240,962 $1,065,920
The difference in the two end balances after 5 years of mortgage payments is $193,229to the benefit of the buyer. So while the mortgage rates have increased since the height of our average prices, the drop in prices certainly outweigh the rate hikes by $193,229.00 over the course of a 5 year fixed mortgage.
In addition to the $193,229 savings, there is another benefit to buying now vs the peak which is the difference in the dollar amounts of each down payment. 20% of $1,856,258 = $371,251 versus 20% of $1,524,237 = $304,847 for another savings of $66,403. There's also a small savings in the total amount of the mortgage payments paid of $8712.00. Adding all of these savings together ($193,229.00+$66,403.00+$8712.00) equals $268,344.00.
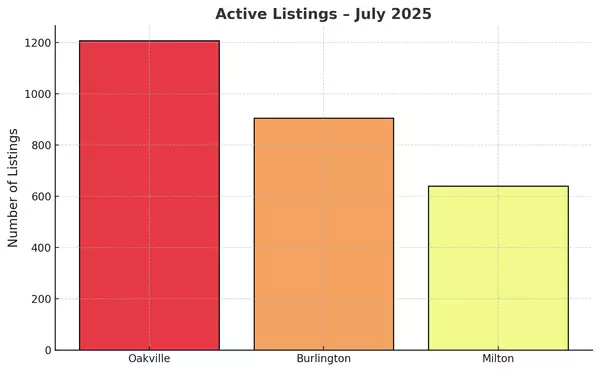
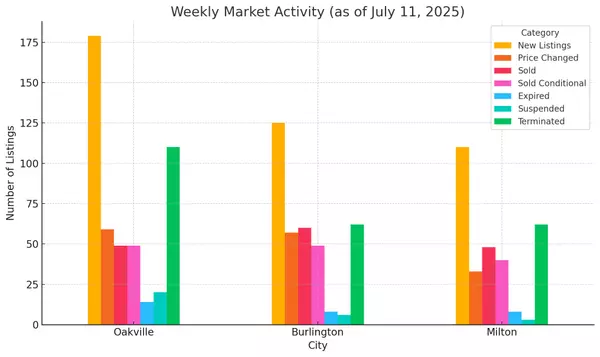
Have a look at the attached graphs for Oakville, Milton, or Burlington. I started tracking in a detailed fashion back in March 2017 which was the last time we had a peak average price that corrected by 20% in 4 months time. Back then the original catalyst was the foreign buyer's tax and as the market was trying to bounce back we got hit with 5 rate hikes which certainly stalled the come back by about 24 months. The market was quite flat for a 2 year period and started gaining serious momentum in the last half of 2019, then caught fire in 2020 until Feb/March 2022. The charts are a helpful reminder that as interest rate rise, prices come down. In this case prices have come down much further than the cost of financing has risen, giving buyers a 14% edge to their benefit net of the added cost of higher interest rates.
Milton's peak average price happened in February 2020 at $1,352,000 when mortgage rates were 2.44%. Here is what a 20% down 5yr fixed over 25 yr am costed then:
Average Price Rate Monthly Payment w/20% Down
$1,352,000 2.44% $4,813/month
Total Paid (5yrs) Total Principal Total Interest Remaining Balance (5yrs)
$288,777 $167,265 $121,512 $914,335
Compared to Milton's average price in July of $1,082,214 at July's best rate of 4.24%:
Average Price Rate Monthly Payment w/20% down
$1,082,214 4.24% $4,667/month
Total Paid (5yrs) Total Principal Total Interest Remaining Balance (5yrs)
$280,048 $108,964 $171,084 $756,809
We can clearly see here again that the drop in average price has more than made up for the rising interest rate. We have a savings of $157,526 on the remaining balance. We have a savings of $8,729 on the monthly payments, and a savings of $53,957 from the lower down payment for a grand total of $220,212 savings compared to March 2022.
Burlington's highest average sales price was also in February at $1,457,249 when mortgage rates were 2.44%. Let's run the numbers:
Average Price Rate Monthly Payment w/20% Down
$1,457,249 2.44% $5,188
Total Paid Total Principal Total Interest Remaining Balance (5yrs)
$311,257 $180,286 $130,971 $985,513
Compared to July 2020 when the average price was $1,135,359 at 4.24%:
Average Price Rate Monthly Payment w/ 20% down
$1,135,359 4.24% $4,897
Total Paid (5yrs) Total Principal Total Interest Remaining Balance (5yrs)
$293,801 $114,315 $179,486 $793,972
Burlington has the largest percentage savings net of interest. The savings after 5 years is $191,541 on the remaining balance plus $17,456 on the total of the monthly payments and an additional $64,378 on the lower downpayment needed for a grand total of $273,375 which is 18.7% net of interest rate increase.
It is clear that prices have dropped to a level that has put some balance back into the market, where we can most often be the only offer on a property and we can include conditions of finance and home inspections for the buyer's benefit. The big question I keep hearing from my buyers and sellers is when will the prices stop dropping? How much lower will they go? Is it a good time to buy now? Should I sell now before the prices drop further?
While I can't predict the future, I can comfortably say that the market has historically agreed with my opinions (you can fact check me by looking at my previous blogs and videos dating back to 2016 when I started doing them.) So here is my opinion; The Bank of Canada will continue to raise rates until they see inflation dropping. With rising rates, prices go down. When will inflation drop? Pretty soon is my guess. Most rate increases take 6 months to see a real change in inflation. The first rate hike was in March, so we are 5 months in and we have now seen a 15% drop in oil prices and a 20% drop in housing prices. I believe we will still have a September rate hike but I would be surprised if it will be higher than 0.75%, and if there are more to follow September's hike I believe they will be much smaller. Home prices are largely not affected by 0.25% hikes other than they tend not to increase or decrease but stay flat (please see mid 2017-2018 on the attached graphs to see that in action). Once the market has become used to the new higher rates, prices will start to climb once again.
It's incredibly hard to time any market, particularly the real estate market, so I would not recommend market timing as the biggest motivating factor in buying or selling properties for most families who are buying for the purpose of living in the properties for some time, which is the bulk of my client base. Live events such as getting married (needing more space), having children (needing more space), having more children (needing more bedrooms), children getting bigger (needing bigger bedrooms), changing jobs (new location), wanting a better neighbourhood (new location, and some vanity), wanting nicer finishes (vanity), divorce (smaller space), children have grown up (smaller space). Whatever your reason, I'm sure it's a better and more compelling reason than timing the market.
It's a great opportunity to buy as a first time buyer or a move-up buyer since prices have come down. If I was downsizing I would hang on for a few more months.
If anyone is having trouble with approval amounts due to the stress test, I would like to remind you that some select credit unions do not adhere to the stress test since they are not regulated in the same way as the big banks are. If you would like to be connected to any just let me know. 905-399-4269 any time.
https://vid.us/cfftbyhttps://vid.us/cfftby
Categories
- All Blogs 100
- bank of Canada 34
- Bronte Oakville Real Estate 30
- Burlington Real Estate Market 1
- Fear vs Opportunity 1
- Home prices in Burlington 26
- Home prices in Milton 26
- Home Prices in Oakville 35
- interest rate 32
- Milton Real Estate Market 1
- mortgage renewal 28
- Oakville Real Estate Agent 13
- Oakville Real Estate Market Trends 10
- Real Estate Market Update Oakville Burlington Milton 19
Recent Posts
