|
|
|
|
|
|
The video above explains the mortgage renewal graph at the top. Over the next few years we will obviously have people who need to renew their mortgages at higher rates than what they were originally paying. I want to show what the reality of the situation really could look like for people who bought houses in these low interest years. The assumptions are that they bought an average house at average prices so the starting prices for each year are the average prices for December of each year except for this year. I'm also using 5.64% as the renewal rate for every year going forward (I always assume the worst but hope for the best). Most economists believe the rates will start to drop by the end of 2024 but I am not factoring that in.
Something to keep in mind when looking at these numbers is the household income that would have been required to qualify as it adds some important perspective, for instance to qualify in 2018 for a $1,042,084 house, the household income would have been at least $160,000.00. The increase in monthly payments at renewal of $375/month doesn't seem crushing. People who bought in 2020 and 2021 would have needed incomes of $200,000 and $250,000/year to qualify and while an $1100/month increase certainly cramps the lifestyle, I find it hard to believe that it would be debilitating. For people who bought in 2022 and 2023 the picture looks quite a bit better in 5 years from then.
|
|
|
|
|
|
Oakville Market Overview
The average sales price here in Oakville has been boring but good (like a Volvo, or a Toyota) all year long hovering in and around $1,550,000 with very few bumps along the road.
Inventory levels are rising and mostly in the higher price ranges while the number of transactions are getting lower in general.
|
|
|
|
|
|
|
|
|
|
As you can see in this graph, the average sales price has been holding steady all year around $1,550,000.
|
|
|
|
|
|
|
|
|
|
Months of inventory has been steadily climbing from the incredibly low levels it was at throughout the "Covid Years" and is now at a comfortably balanced level if you look at the combined level of inventory including all price ranges.
|
|
|
|
|
|
|
|
|
|
On the surface 2.4 months supply is perfect right?
|
|
|
|
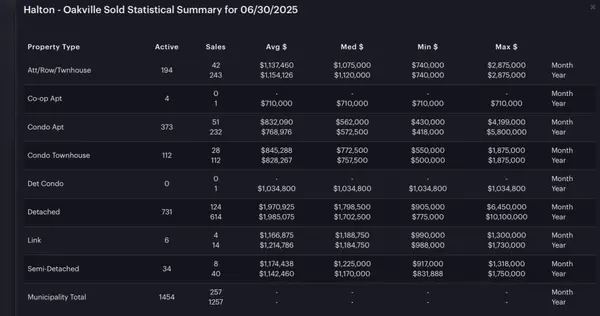
As the spreadsheet below shows, there are some higher price ranges in almost every neighbourhood where we have an abundance of inventory, even a glut in some areas such as the $2,000,000 to $3,000,000 range in Eastlake, Glen Abbey, Old Oakville, Palermo West, Rural Oakville, and even West Oak Trails. We also have over-supply in the $3,000,000 to $4,000,000 range in Bronte East, Bronte West, Eastlake, and Old Oakville.
The lowest price ranges are usually the last to react to changes in the general market while the higher price ranges tend to be much quicker to move the needle.
|
|
|
|
|
|
|
|
|