Trying to time the market? Let me help you.
After an unsustainable start to 2022, and 2 interest rate hikes, we have a more balanced market at hand. We have gone from the ridiculous lows of half a months inventory across Oakville, Milton, and Burlington to about 2 months of inventory. While 2 months of inventory is still extremely low it is quadruple what we have been working with over the last few months. Before now nobody would ever think of 2 months of inventory as balanced. A balanced market is traditionally defined as at least 3 months of inventory, BUT what's happening now that buyers are seeing four times the number of homes available is that it gives buyers reason to pause and not act so hastily as they did throughout the winter months. Buyers are also enjoying the newfound freedoms of less covid restrictions which could be having an affect on their motivations as the travel industry begins to rebound.
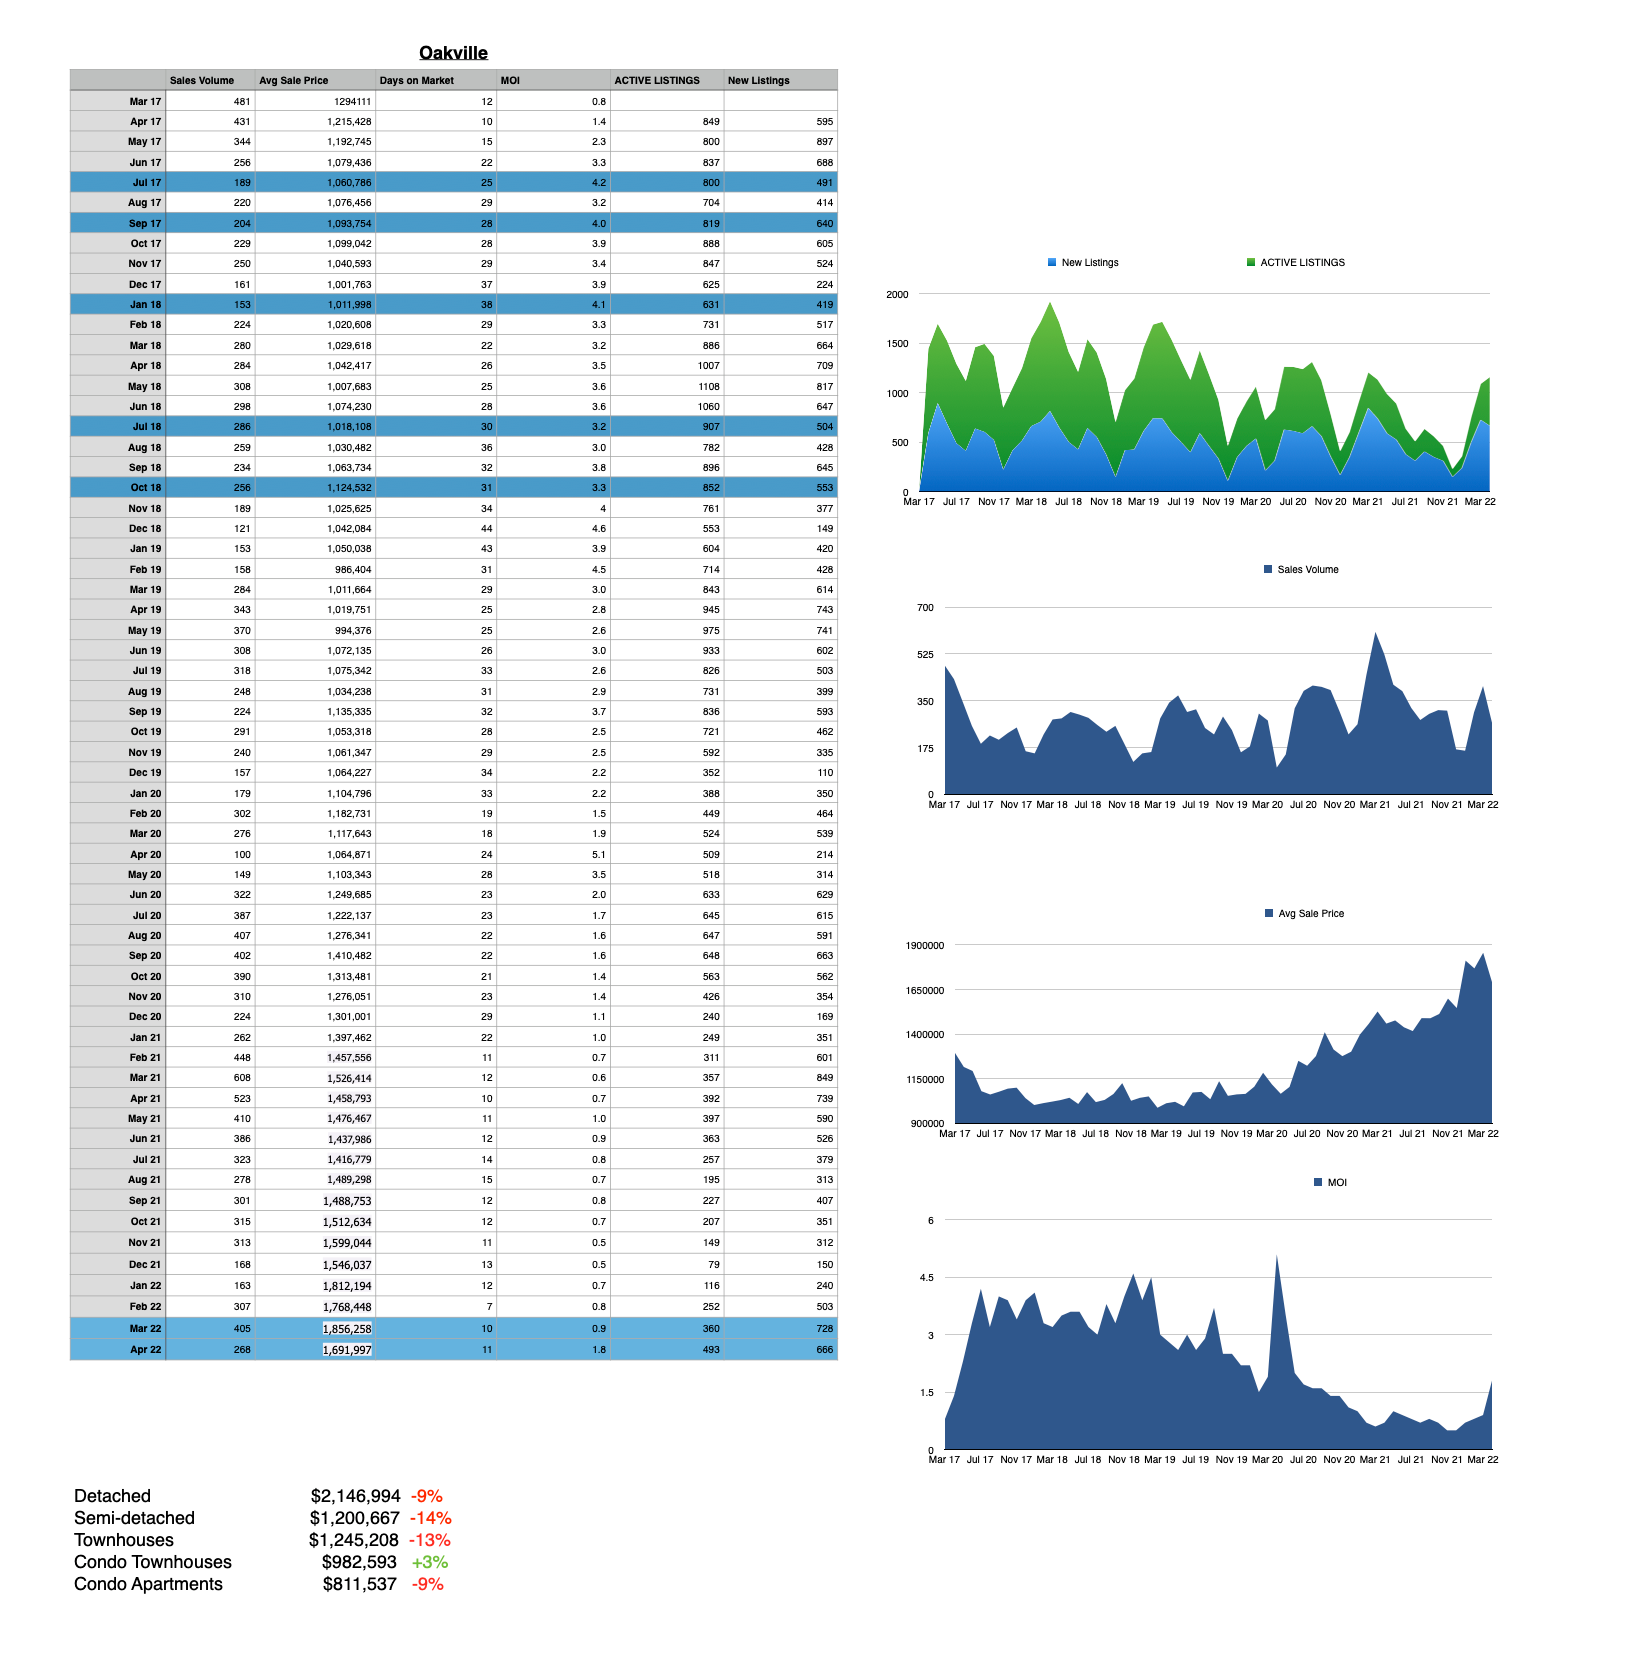
Over the last couple of months we have seen interest rate hikes of 0.75%, increased inventory levels, reduced demand, and lower prices because of it. By the end of March we had a record high average price of $1,856,256. By the end of April the average price slipped 9% down to $1,691,997 wiping out most of the first quarter gains. $1,691,977 represents a 14% gain from one year ago, and a whopping 54% over two years ago.
The market has been expecting another 0.50% rate increase by the Bank of Canada in June to help reduce inflation. The big question is how much of this rate hike has been built in to current pricing and how much is still to have an effect on current pricing. The answer is surprisingly simple. The 0.75% increase represented approximately 9% worth of selling price which is exactly the price decline we saw over the last 30 days. It will be interesting to see if the next 0.50% rate increase will translate into another 6% drop in average prices.
The other big question is when will the prices hit bottom before they start to go up again? I believe the indicator to watch for is our inflation rate (Consumer Price Index). Since the reason the Bank of Canada raises their rates is to lower the rate of inflation, keeping a watch on the Consumer Price Index every month can give you a good indication of what the Bank of Canada might do next. The next release date of CPI numbers is May 18th.
Once the Bank of Canada believes they have done enough rate hikes, the demand for housing will usually come back, slowly at first and building into a frenzy like it did in 2018 and 2019.
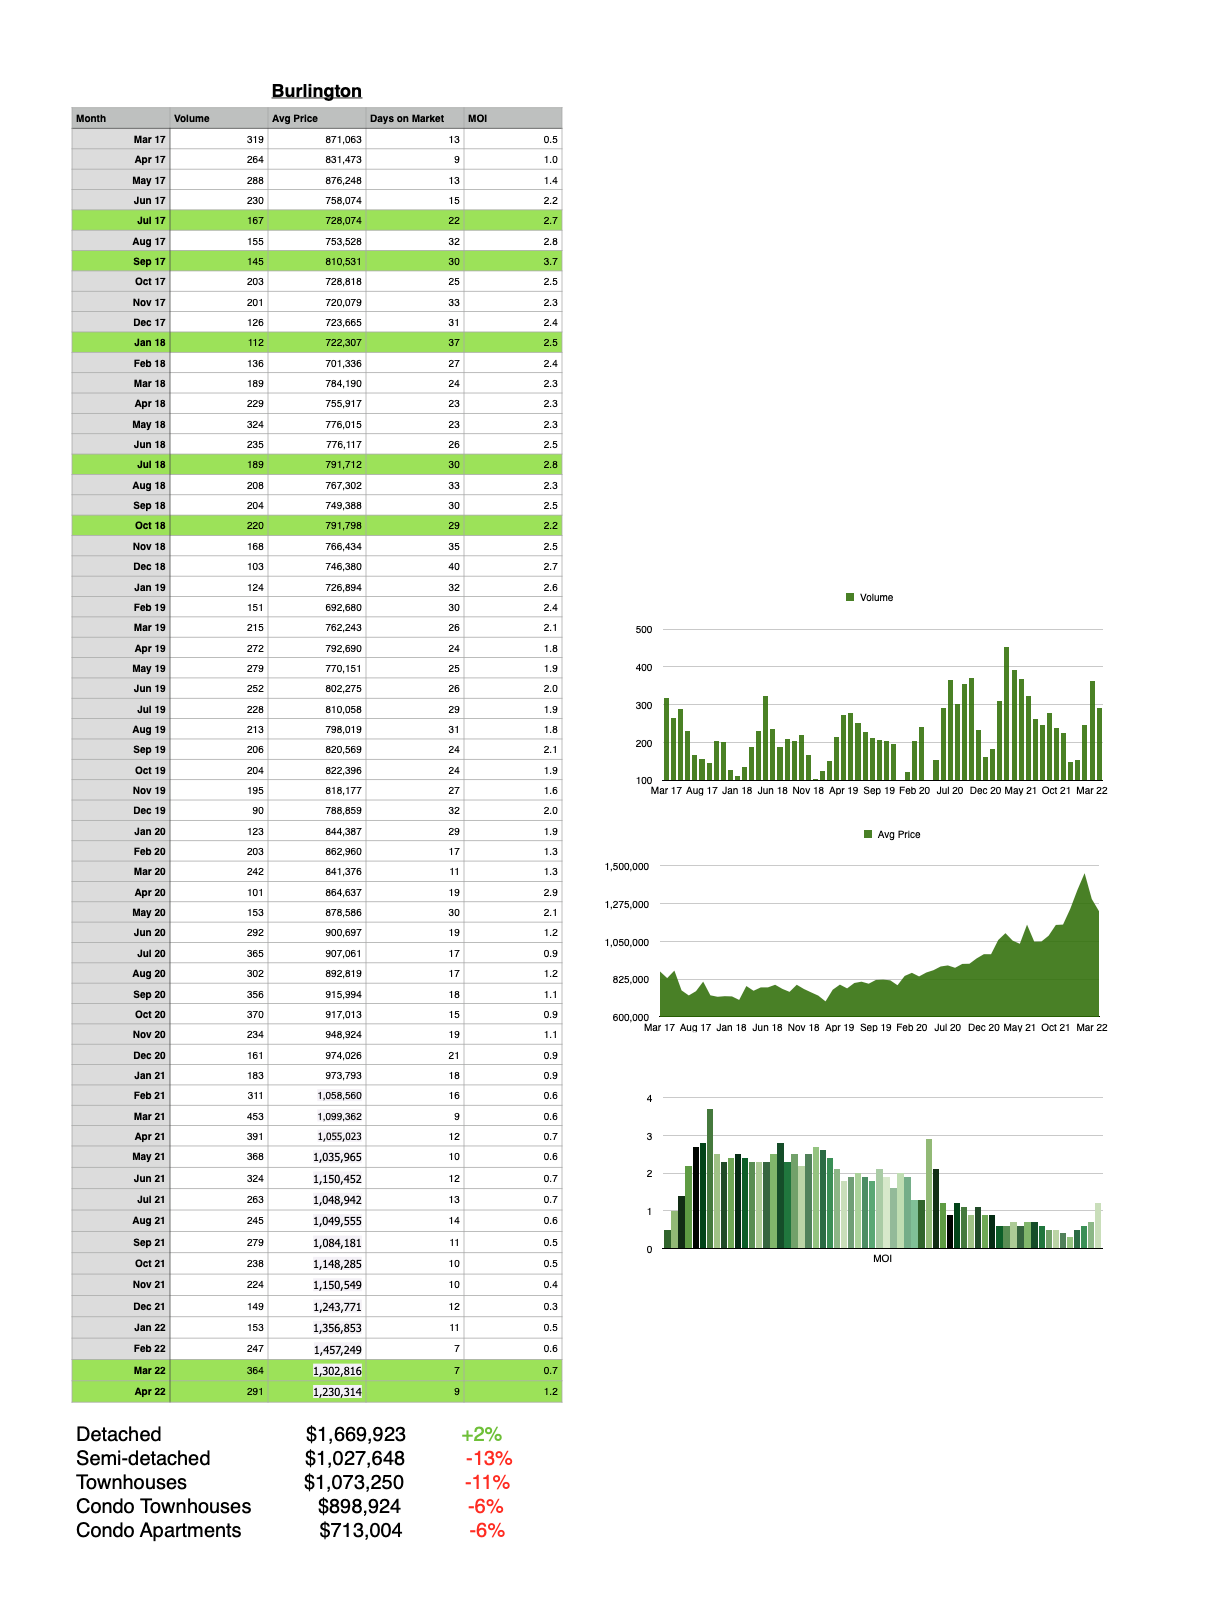
You could argue that the next rate hike has already been priced in to the Burlington market as Burlington’s prices have already dropped 17% over the last 60 days (11% down in March and 6% down in April) from its record high $1,457,249 Burlington’s average price of $1,230,314 is still 16% higher than 12 months ago and 42% higher than 2 years ago.
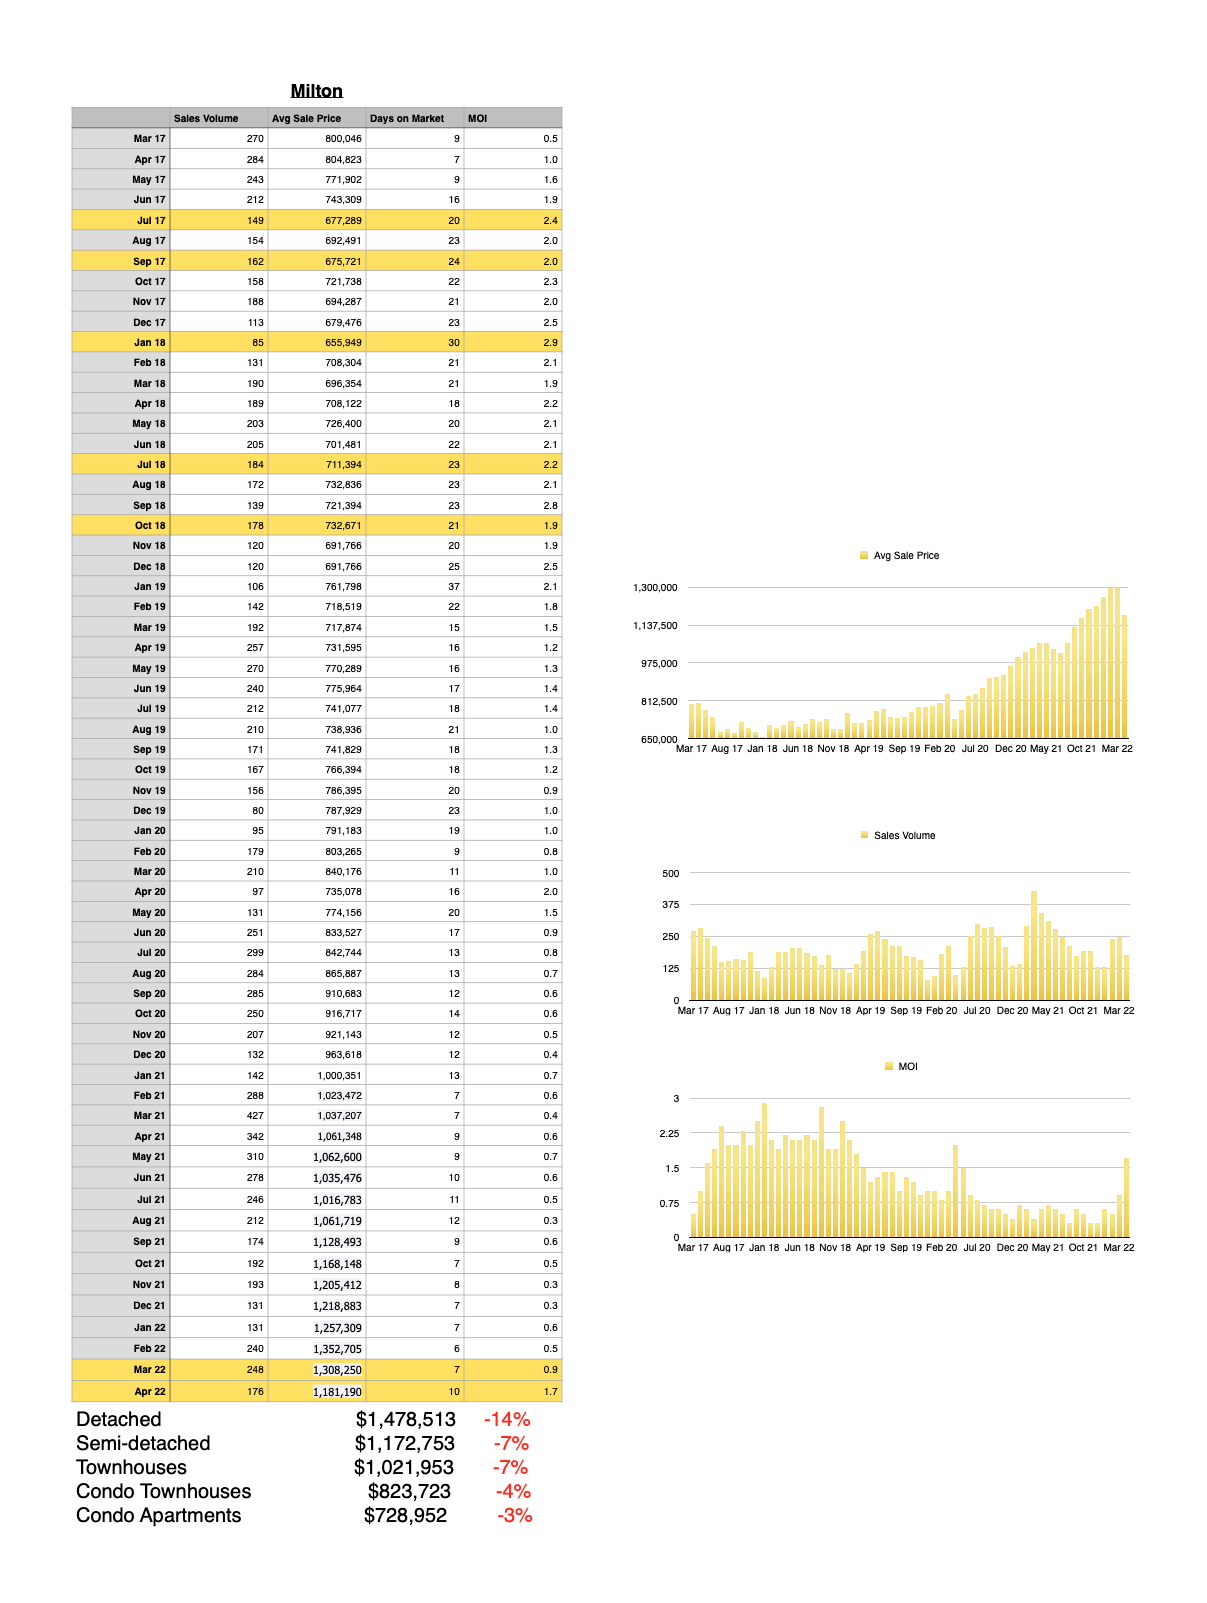
Milton also hit its record high of $1,352,705 in February and then dropped 3% in March to $1,308,250. The big move in Milton came over the last 30 days with a 10% drop down to an average price of $1,181,190.
It’s interesting to see how differently these three markets have reacted.
Both Burlington and Milton hit their peaks in February while Oakville peaked in March. Burlington’s big drop came in March while Milton and Oakville had their big drops in April. Here are the total drops since their peaks:
Oakville 9% down @ $1,691,977
Burlington 17% down @ $1,230,314
Milton 13% down @ $1,181,190
All of these stats appear to be great news for first time buyers and move up buyers, but in reality the drop in prices are tempered by the difference in affordability that the rate increases represent.
Over a 35 year period the real estate market rises by 5% per year and while there are some ups and downs along the way the market spends over 90% of the time going up. I would recommend buying and selling real estate when your needs require it rather than trying to time the market. In a balanced market like this one, you can now include conditions of financing and home inspections once again which is in your favour and provides for a less stressful buying process.
If you would like to chat about the market, call me at 905-399-4269.
***For those of you who are new to my updates, the graphs below contain the number of homes sold in a month, the average sale prices, the average days on the market and months of inventory. You will notice that the average price and months of inventory have an inverse relationship. The highlighted months are the months where the Bank of Canada raised interest rates, so you can see what happened back in 2017/2018 when the BOC raised rates although the bank wasn't as aggressive at that time as it didn't need to be.***
Categories
- All Blogs 103
- bank of Canada 36
- Bronte Oakville Real Estate 33
- Burlington Real Estate Market 2
- Fear vs Opportunity 3
- Home prices in Burlington 27
- Home prices in Milton 27
- Home Prices in Oakville 38
- interest rate 33
- Milton Real Estate Market 2
- mortgage renewal 29
- Oakville Real Estate Agent 15
- Oakville Real Estate Market Trends 12
- Real Estate Market Update Oakville Burlington Milton 20
Recent Posts