July 2019 Market Intelligence
Big Volume, Higher Prices
While May saw the biggest sales volume since the glory days of 2017, it was June that enjoyed the big price increases.
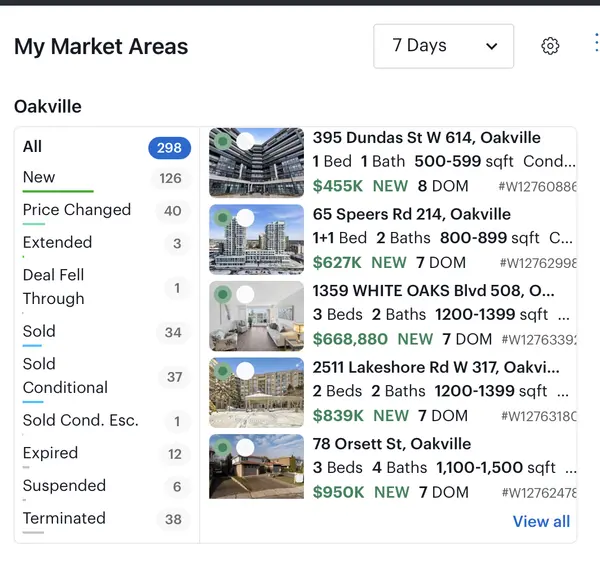
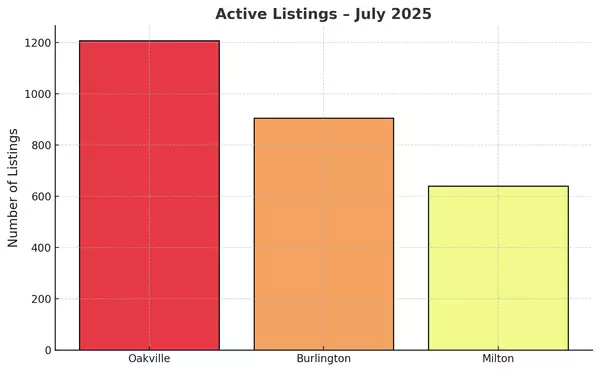
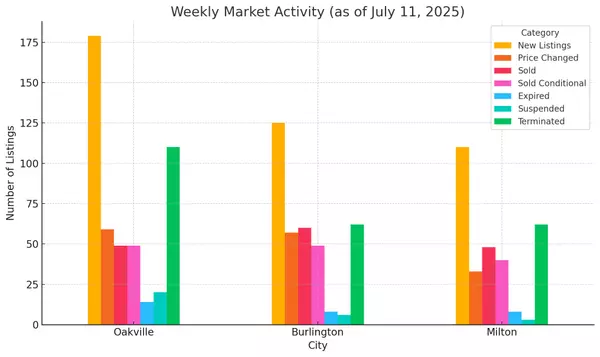
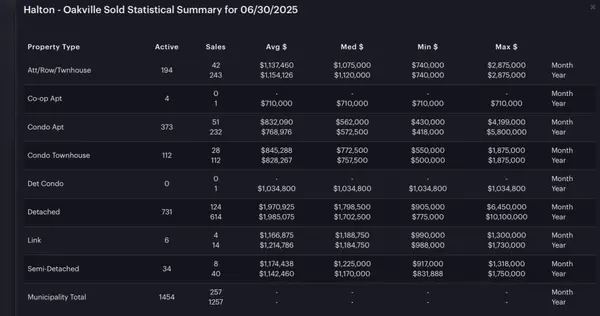
Oakville’s average sales price jumped up to its highest point since June 2018. Sales Volume was still over 300 units which caps off the busiest spring since 2017. Oakville’s inventory levels inched up a bit to 3 months of inventory which indicates a balanced market overall, but keep in mind that the detached months of inventory sits at 3.9 and the $2m plus category is way higher at 8 months supply (buyer’s market) while townhouses and condo apartments are at only 2 months supply which is firmly a seller’s market. On a side note, the rental market in Oakville is on fire with 4-6 offers on almost every rental in town, so its a nice time to be a landlord in Oakville. See the graph below for details:

Burlington has been very active with the average selling price topping $800,000 for the first time since September of 2017 and with only 2 months of inventory overall its definitely a seller’s market in Burlington with big price gains on big volume. See the graph below for details:

Milton is also on fire and has been for quite some time. Milton’s average selling price has not been this high since May of 2017! With inventory levels of only 1.4 months, the average prices are bound to keep climbing. It’s clearly a seller’s market in Milton. If you see a house that’s been on the market for more than 3 weeks, it’s overpriced. See the graph below for details:

Categories
- All Blogs 103
- bank of Canada 36
- Bronte Oakville Real Estate 33
- Burlington Real Estate Market 2
- Fear vs Opportunity 3
- Home prices in Burlington 27
- Home prices in Milton 27
- Home Prices in Oakville 38
- interest rate 33
- Milton Real Estate Market 2
- mortgage renewal 29
- Oakville Real Estate Agent 15
- Oakville Real Estate Market Trends 12
- Real Estate Market Update Oakville Burlington Milton 20
Recent Posts